
Rockfall Hazard Assessment – Acrocorinth
Preliminary evaluation of rockfall hazard and design assessment of protective barrier systems.
Patras • Greece | Available for projects nationwide
Project Overview
The study area is located at the slopes of Acrocorinth, characterized by steep limestone formations and intense discontinuity-controlled instability.
The objective of the assessment was to evaluate potential rockfall trajectories and quantify impact energy in order to support the design of rockfall protection barriers.
Location:
Geology:
Slope inclination:
Assessment type:
Objective:
Corinth Region, Greece
Massive limestone with structural discontinuities
50–90°
Rockfall simulation modelling
Estimated kinetic energy, barrier system design
Engineering Challenge
The steep limestone escarpment exhibits structurally controlled detachment mechanisms driven by joint sets and weathering-induced block separation.
The presence of infrastructure at the slope toe required quantification of impact energy, bounce height and runout distance in order to define appropriate interception measures. decisions through structured technical analysis.
Analytical Workflow
The assessment integrated field investigation, GIS-based terrain analysis and calibrated rockfall modelling.
Structural mapping and slope derivatives were used to delineate potential detachment zones, while restitution parameters were defined according to surface roughness and lithological characteristics.
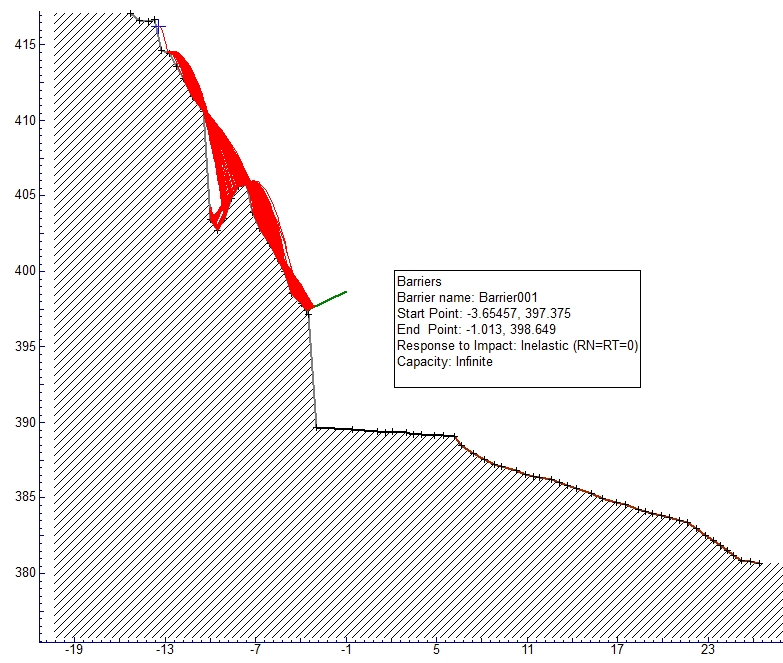
Simulated rockfall trajectories along representative slope profile, indicating bounce height distribution and runout extent.
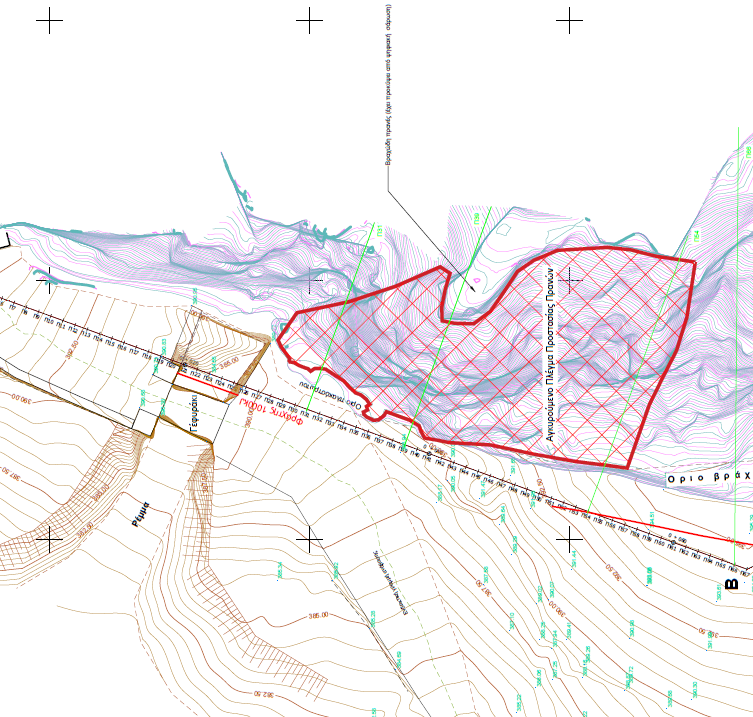
Technical–geological mapping including structural domains, potential detachment areas and proposed rockfall protection layout.
Modelling Parameters
| Parameter | Value | Basis |
|---|---|---|
| Block volume | 0.30–0.50 m³ | Field estimation |
| Rn | 0.40 | Limestone surface |
| Rt | 0.75 | Surface roughness |
| Slope angle | Up to 65° | DEM derivative |
Rockfall simulations were performed to quantify impact energy, bounce height and runout distribution along the slope profile. Multiple release points were analyzed to define trajectory envelopes and identify critical interception zones.
The modelling incorporated site-specific restitution coefficients were evaluated against infrastructure exposure to support protective barrier sizing.
The restitution coefficients (Rn, Rt) were derived through back-analysis of observed rockfall behavior and calibrated using the Anarock analytical framework. Field observations and surface roughness classification were incorporated to reduce modelling uncertainty and ensure parameter traceability.
Results
Rockfall trajectories indicated maximum bounce heights exceeding X m and impact energies reaching up to XXX kJ near the infrastructure corridor.
Runout distances were controlled by slope morphology and surface roughness variability.
| Parameter | Value | Engineering Implication |
|---|---|---|
| Maximum impact energy | 850 kJ | Barrier class ≥ 1000 kJ required |
| Maximum bounce height | 4.2 m | Minimum interception height 5 m |
| Maximum runout distance | 78 m | Barrier placement at slope toe |
| Trajectory concentration zone | Central sector (35% clustering) | Priority protection zone |
Values shown represent preliminary modelling outputs for demonstration purposes.
Barrier System Design Assessment
Based on calculated impact energy envelopes, rockfall barrier systems within the range of 1000 kJ were evaluated.
The required interception height and positioning were defined according to trajectory clustering and bounce distribution.
Engineering recommendations were derived from quantified terrain behaviour and calibrated modelling parameters, ensuring traceable and defensible design decisions.